Service-Level
Service level
The service level (or service grade) is, generally speaking, a business indicator for the level of service achieved for customers.
In todo4teams, the following four time stamps are created when a ticket is processed:
- Creation Date: Creation of the ticket, manually or by receiving an email, SMS, web form, etc.
- Start Date: Time the ticket is taken over by an agent
- Finish Date: Time the ticket is completed/closed
- Scheduled End Date: Scheduled time of latest completion
In todo4teams, the service level of a team/skill is calculated as follows:
Service level = Proportion of tickets (of the total number of tickets for the selected reporting period) where the end time < target time, i.e. which were completed within the time promised to the customer.
A service level target can be set for each team in the administration.
The statistics displayed in the "Service Level" menu item evaluate exactly this key figure for the current day in intervals of 15 minutes. The target level is shown in yellow in the diagrams.
For each time interval and the selected team, the tickets whose target time is in this quarter of an hour are considered. If, for example, there are 10 tickets and 5 of them have already been completed, all of them within the promised target time, the service level is 50%.
Please note
- that the service level is also shown for times that are still in the future! The service level for these time intervals can therefore still be increased if tickets are still completed by then. The service level does not change for past time intervals and
- that the service level is set to 100% if there are no tickets with matching target times in a time interval,
- that the diagrams show the service level for the time of day between 6 a.m. and 10 p.m.
This diagram shows a service level that drops to 66.6% between 5 p.m. and 5:15 p.m.:
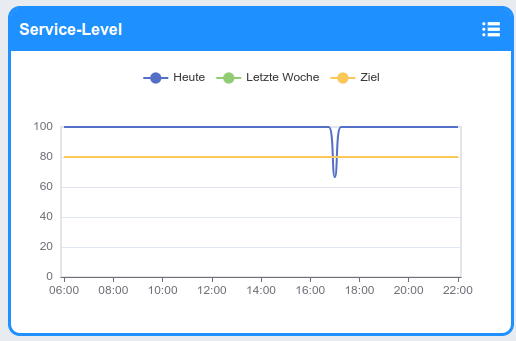
The service level was read at 4 p.m. So there would still be time to raise the service level above the target of 80% by quickly dealing with tickets.
For each selected team, you can also see on this page the time course of new tickets being generated every 15 minutes.
Here, for example, three new tickets were generated around 4 p.m. (see below).
Both diagrams combined allow you to put the trend of team workload and service level in relation: If the service level for the next few hours is below the target level and the rate of new tickets being generated is high, you may need to strengthen the team to maintain the desired service level.

Basic considerations for calculating the service level can be found here.